

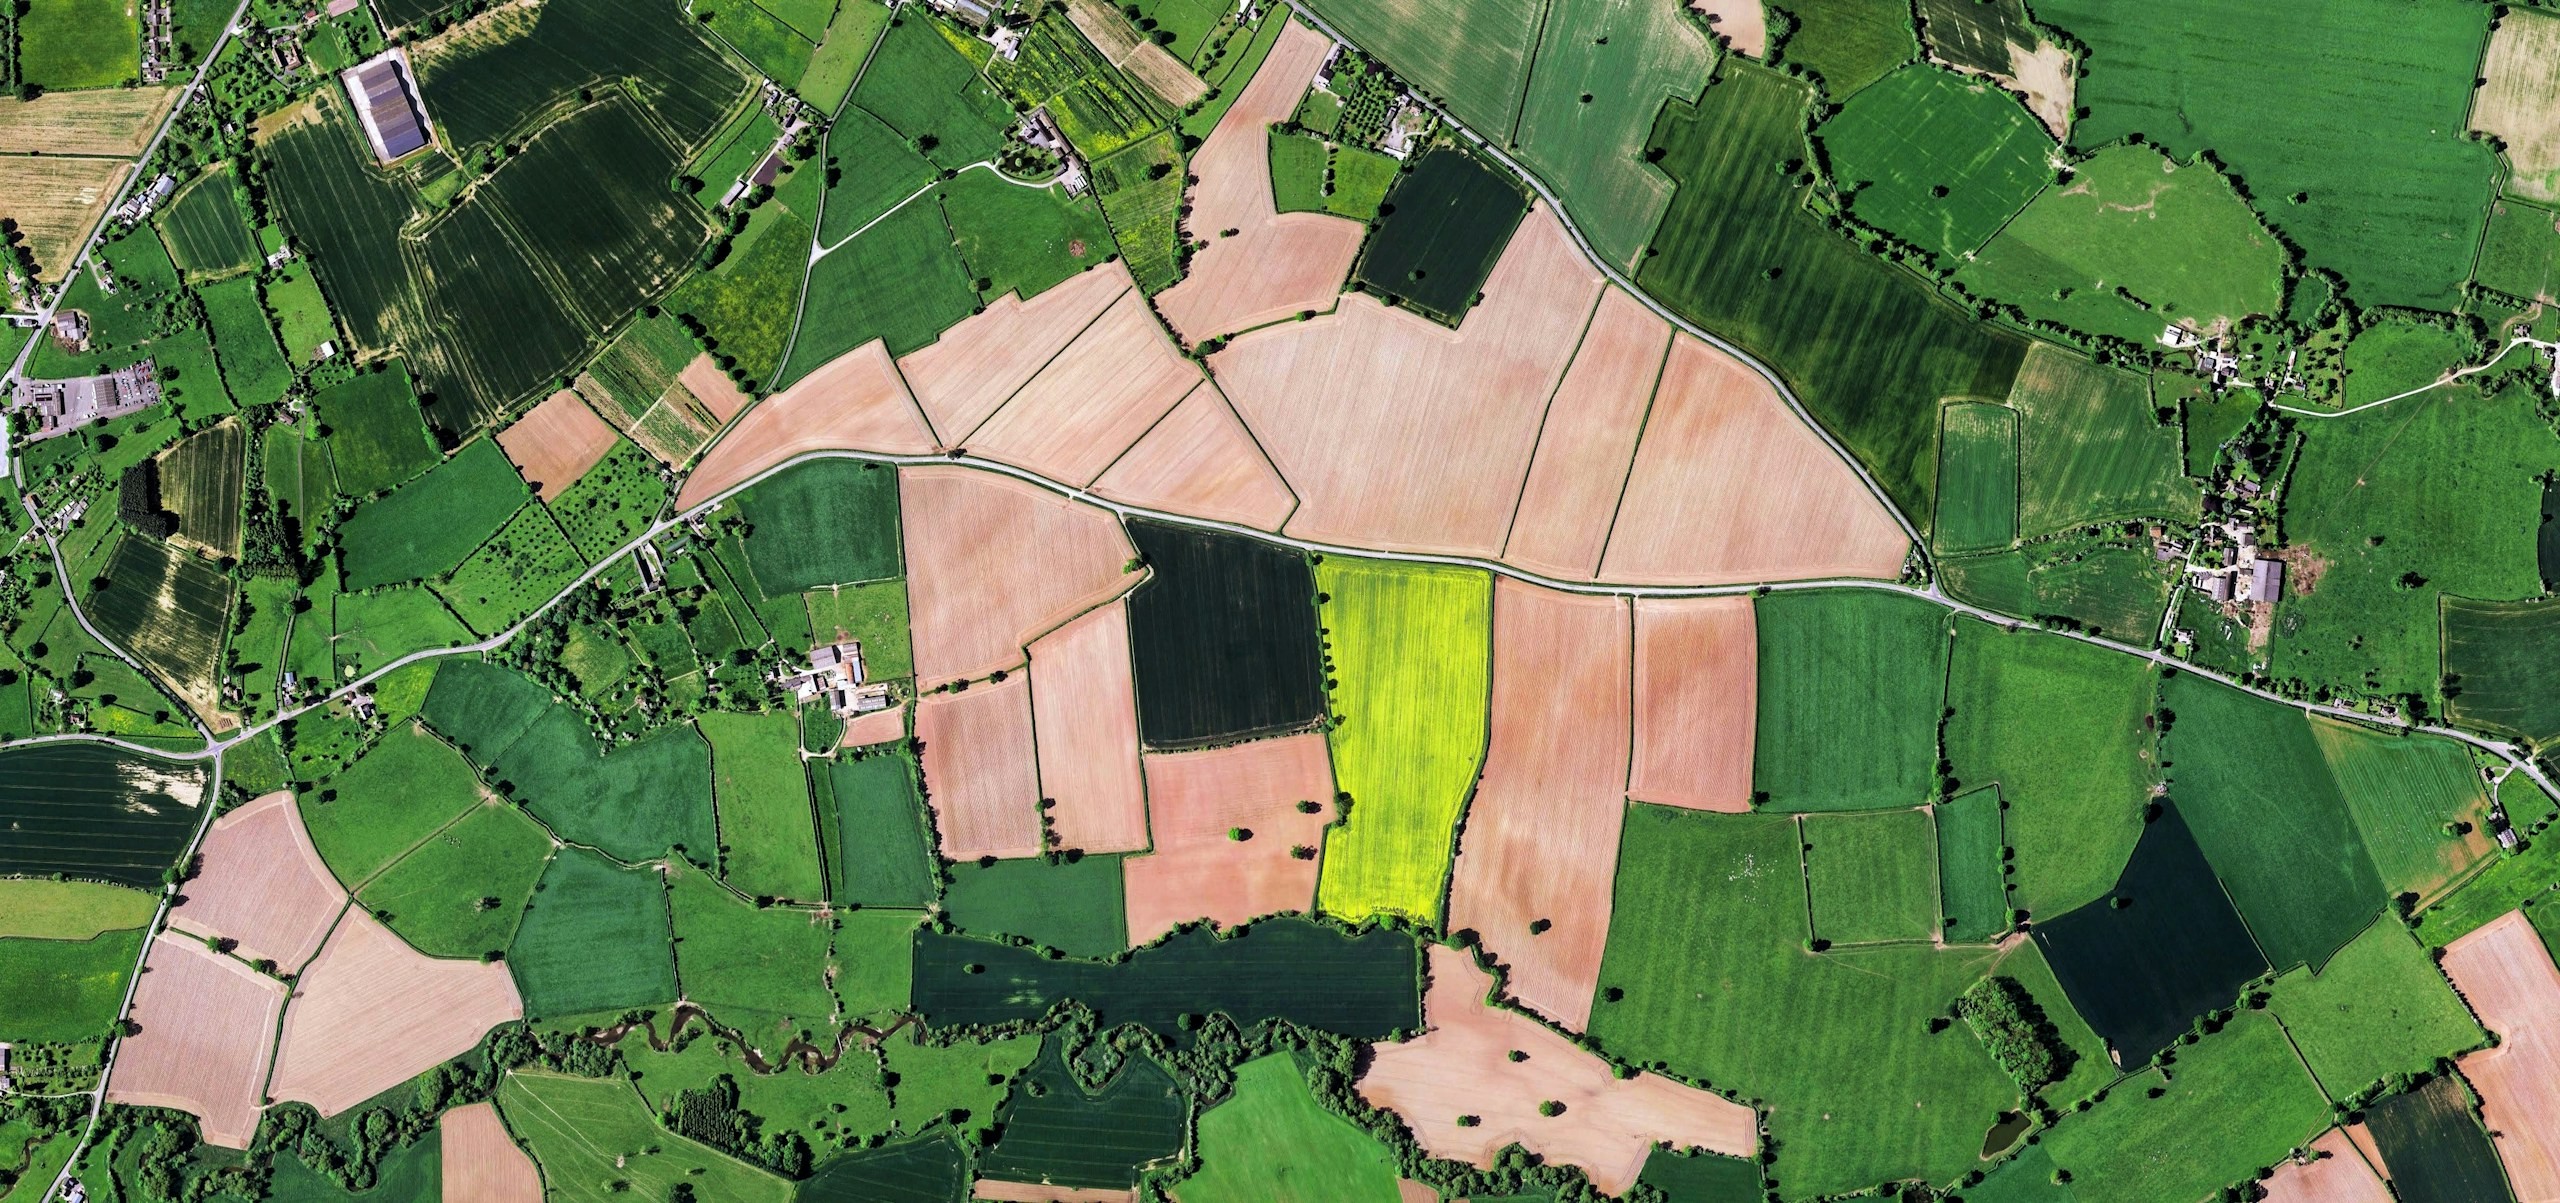
WebGIS Analytics Dashboards
From scattered data to one view of what matters. Bring maps, operational data, assets, networks and analytics together in an intelligent WebGIS environment that helps teams understand what is happening, where it is happening and what action should follow.
The Panovis advantage
A dashboard is only useful when it changes what someone does next.
Organisations rarely struggle to collect data. The challenge is turning multiple layers, systems and datasets into a clear operational picture. A map can show where something is; a dashboard can show what is changing—but neither is enough when the decision requires context. We bring spatial, operational and historical information into a common analytical environment so users can move from identification to understanding to action without searching across disconnected systems.
The Panovis logic
Location turns a data point into a decision.
A number becomes more meaningful when you know where it occurred, what surrounds it, which assets are affected, what happened before and what could happen next. Our WebGIS approach layers location intelligence with operational data, historical context, real-time feeds and analytical models. The result is not another visualisation layer—it is a decision environment where patterns, risks, relationships and scenarios can be explored before action is taken.

What we cover
Your questions, answered by your data
Suitability Analysis
Bring spatial, physical, environmental and operational criteria together to identify suitable locations, corridors and areas for development or intervention.
Risk Identification & Management
Identify exposed locations, assets and communities, understand contributing factors and prioritise action before risk becomes disruption.
Network & Service Analysis
Understand network reach, connectivity, accessibility, service demand and consumption through location-aware analysis of distributed infrastructure.
Asset Intelligence
Combine asset location, condition, performance and operational history to reveal vulnerabilities, priorities and maintenance needs across the network.
Scenario Modelling
Test alternative scenarios against the same spatial and operational evidence to understand potential impacts before committing resources or making changes.

What the analysis has been built on.
400+
Projects Delivered
400+
Specialists & Experts
5
Global Locations
160,000+ckm
Power Grid Intelligence & Asset Inspection
100,000+sq km
Urban Geospatial Intelligence & Digital Mapping
Where it applies
Where one version of the truth matters

Infrastructure
Infrastructure projects generate complex spatial, engineering, asset and field data across their lifecycle. Our integrated geospatial intelligence combines UAV surveys, GIS/WebGIS, LiDAR, photogrammetry, asset mapping, digital twins and spatial analytics to enable informed planning, monitoring and lifecycle management.
Explore sector
Environment, Forest & Climate Change
Environmental programmes need reliable spatial data to monitor forests, biodiversity, land cover and climate risks. Our solutions combine UAVs, remote sensing, LiDAR, GIS and spatial analytics for monitoring and sustainable resource management.
Explore sector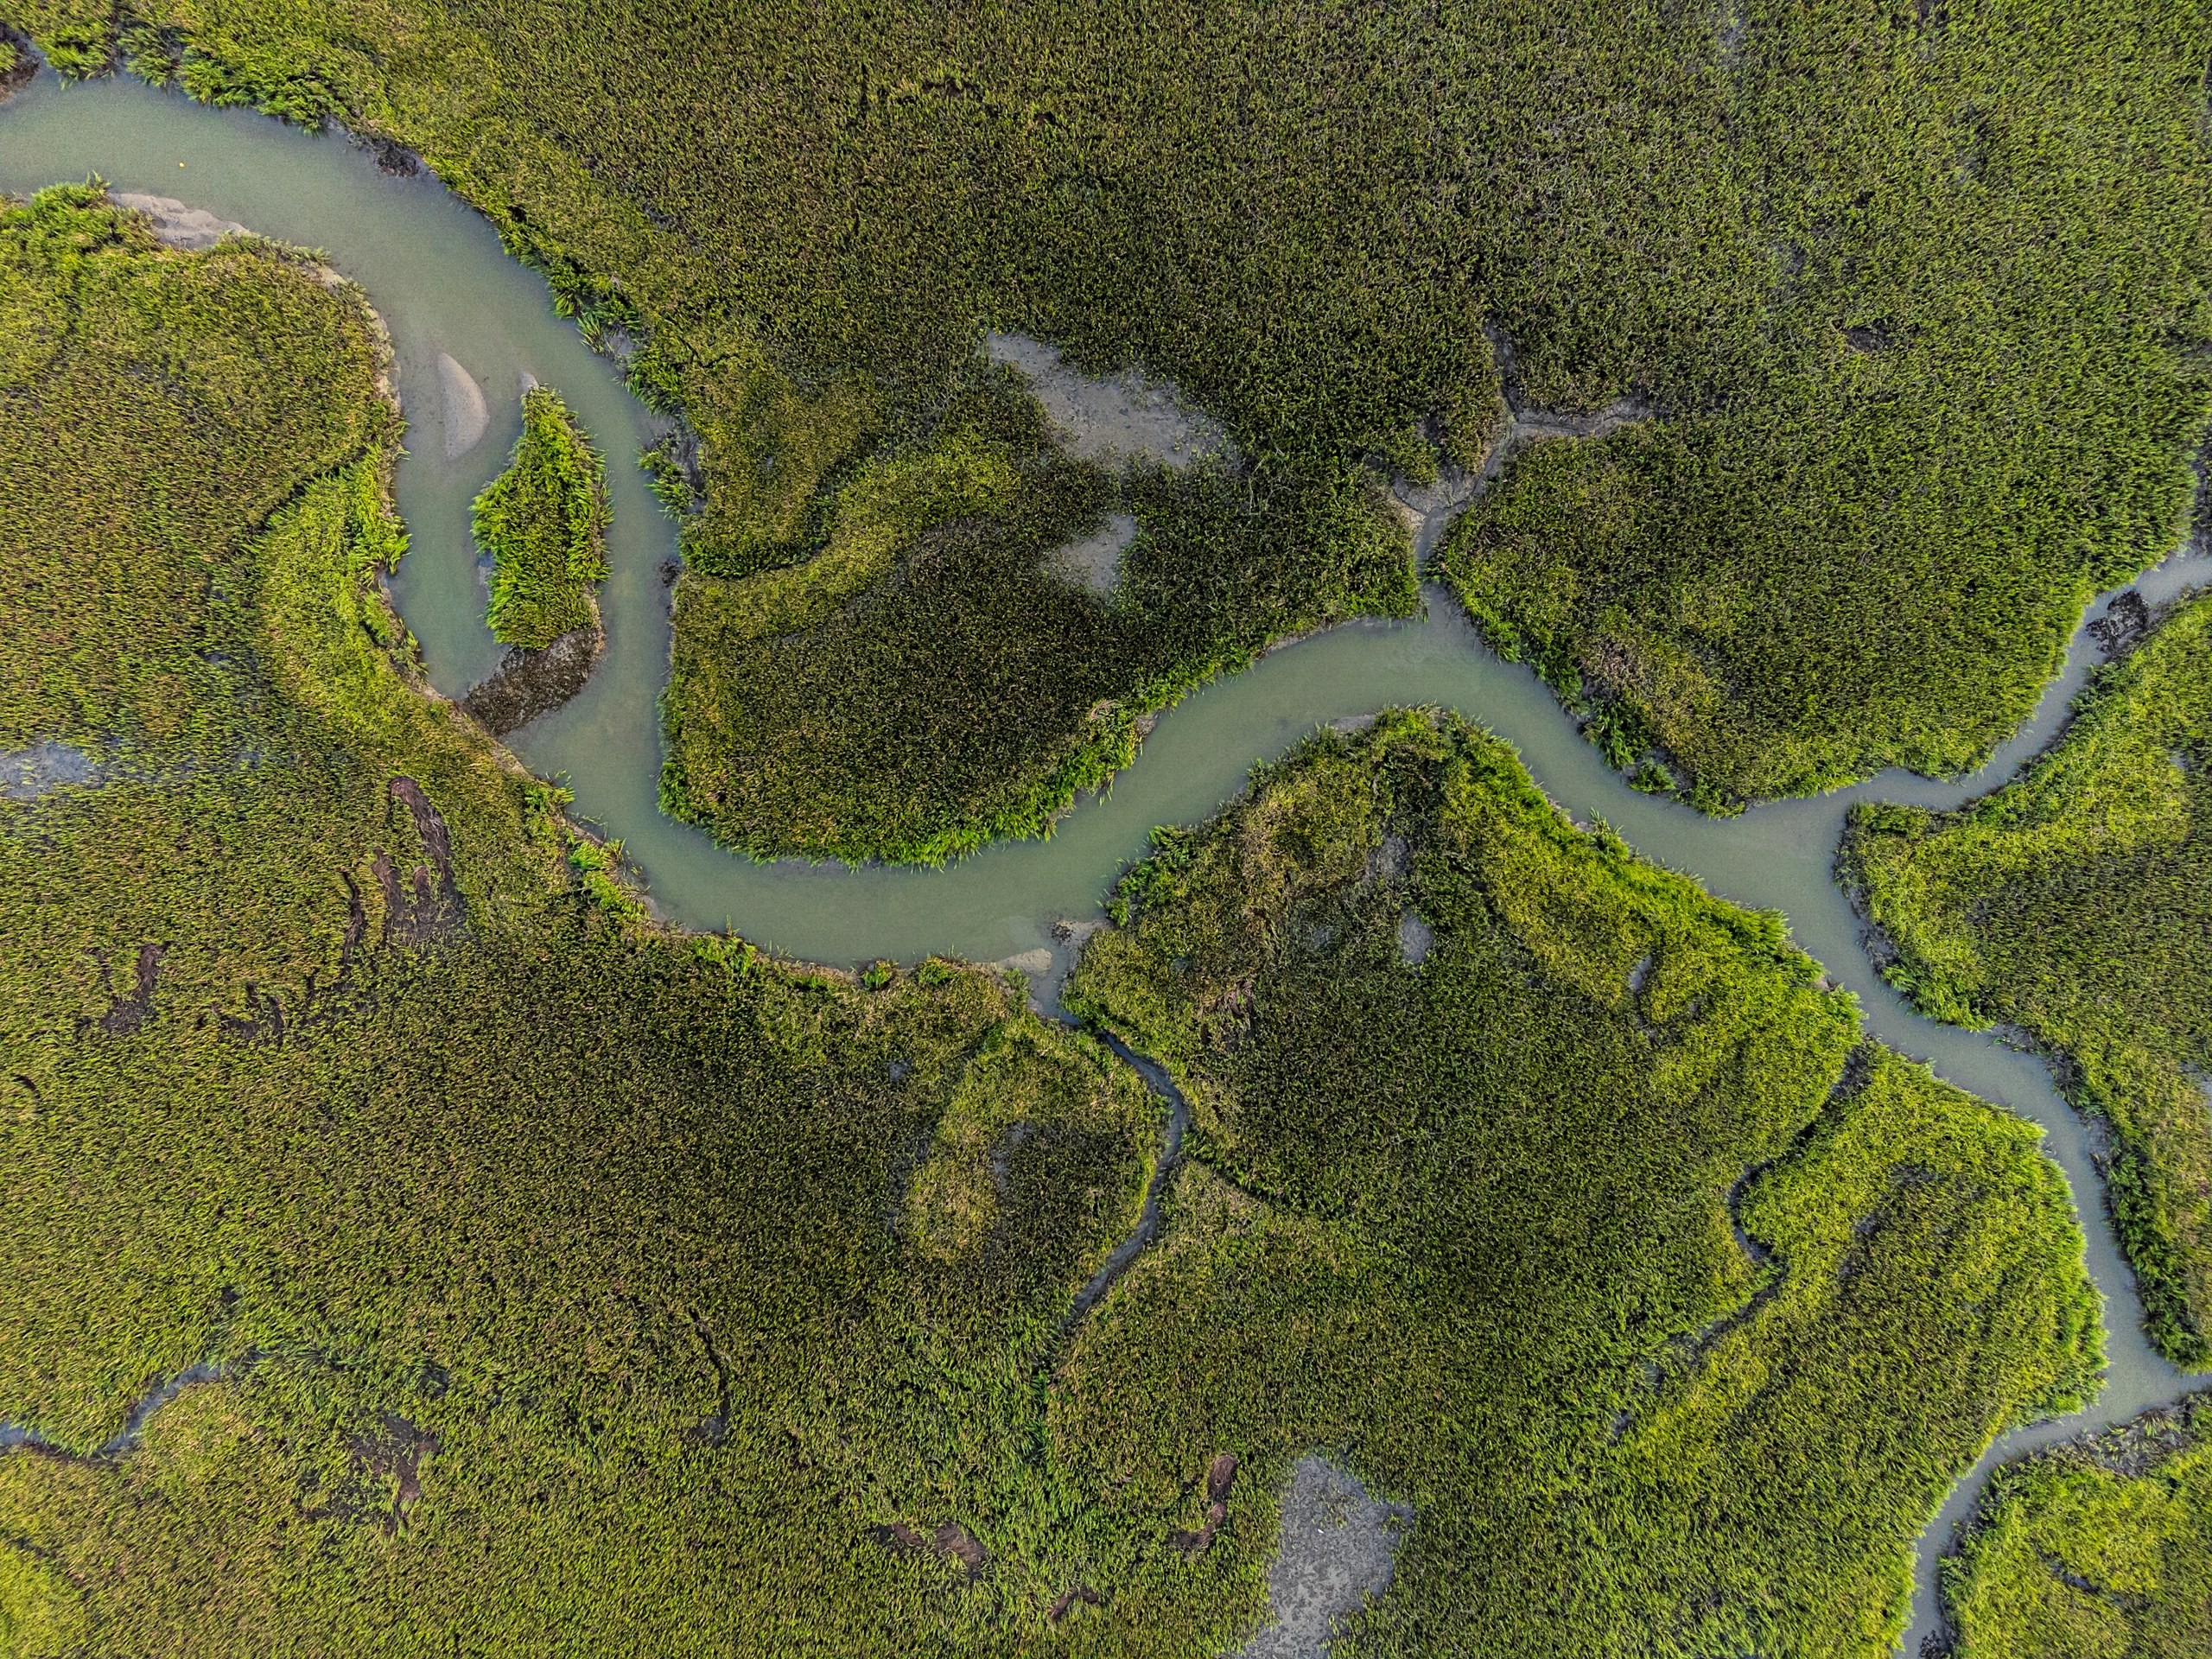
Water Resources
Water-resource programmes require integrated intelligence across terrain, hydrology, irrigation networks, reservoirs and command areas. Our geospatial solutions combine UAV surveys, DEM/DTM, remote sensing, hydrological analysis, water-asset mapping, GIS/WebGIS and spatial analytics for planning, monitoring and resource management.
Explore sector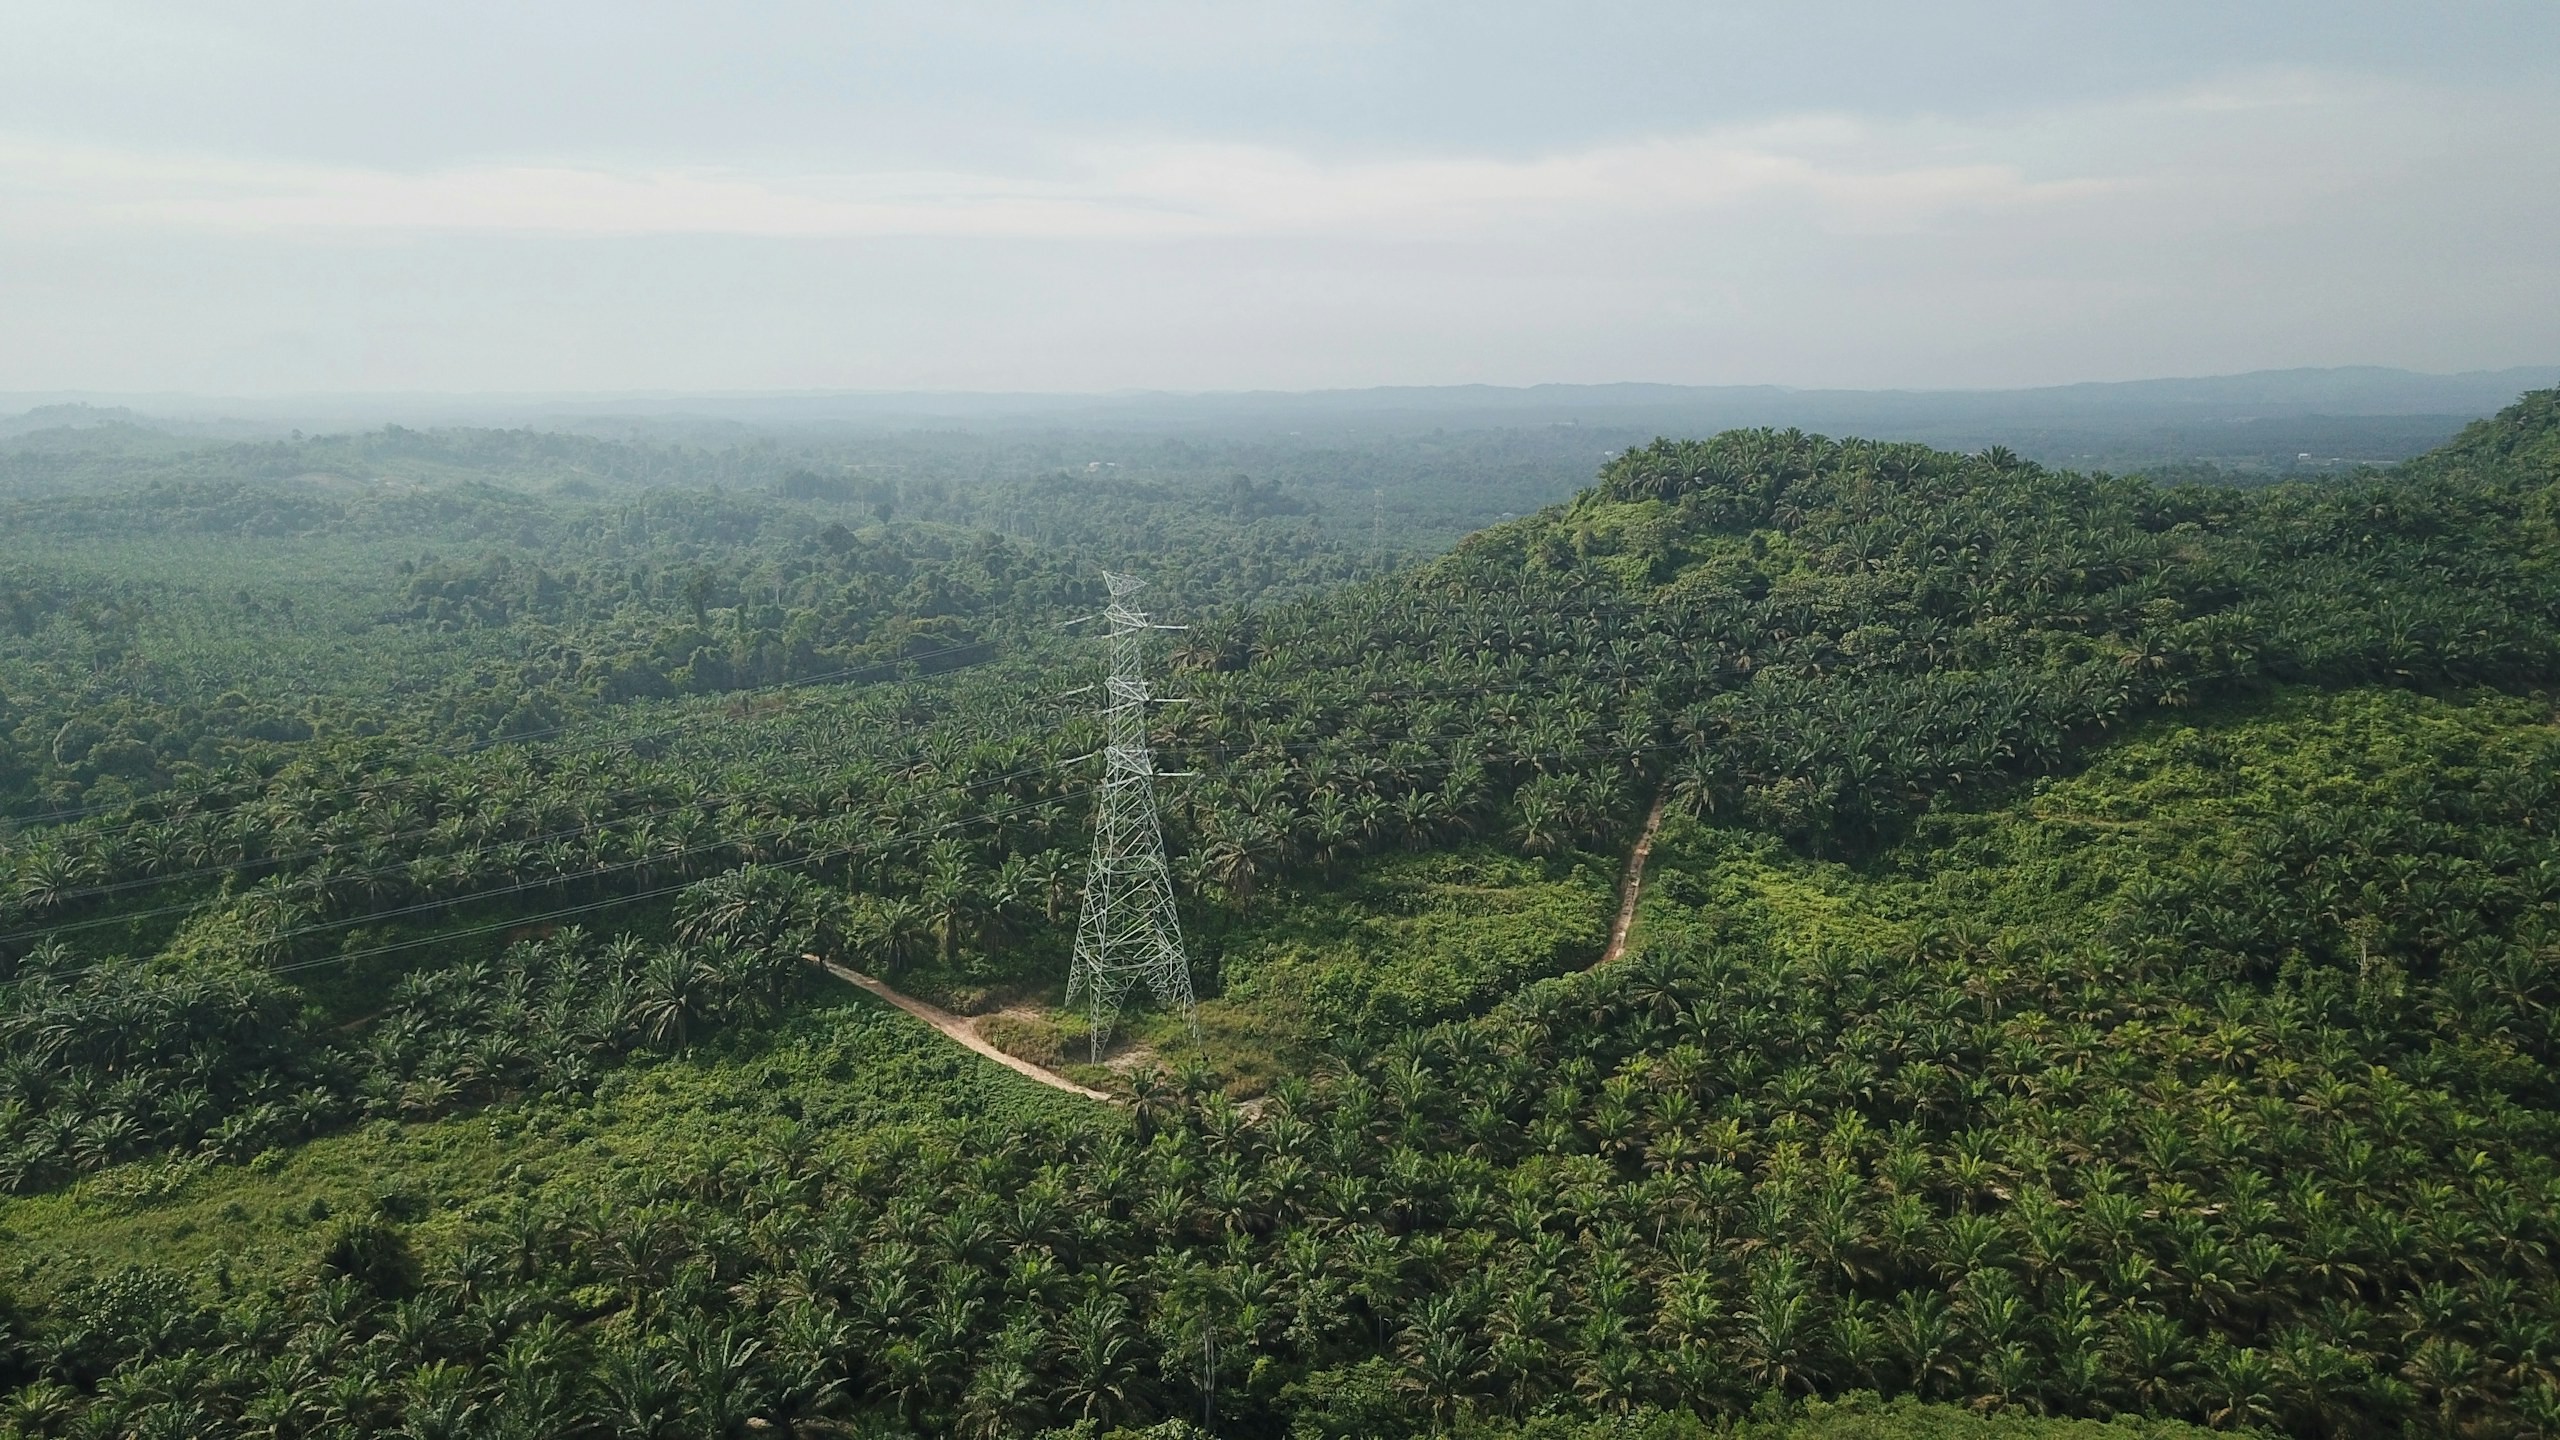
Utility & Energy
Distributed utility networks require precise asset visibility, network intelligence and timely operational insight. Our connected utility intelligence integrates Utility GIS, network mapping, IoT, Field GIS, asset tracking, network analytics, EAM, WebGIS and operational dashboards to connect field operations with enterprise decision-making.
Explore sector
Let’s solve the spatial challenge
Tell us what you’re trying to build, map, monitor or manage. From large-scale surveys and geospatial intelligence to digital twins, asset monitoring and enterprise integration, our team can help define the right data, technology and delivery approach for your requirement.
- EnquiriesPanovis@trentar.com
- Registered officeMumbai, India