


Data & Locational Analytics
Turn data into insight. Turn location into intelligence. Transform operational, spatial and historical data into clear intelligence that reveals what is happening, where it is happening, and what deserves attention next.
The Panovis advantage
Data without context tells only half the story.
Data can be accurate, current and abundant—and still fail to support a decision. The difference lies in how information is connected to the places, assets and events it describes. We bring spatial context, operational data and business questions together so analytics becomes something people can act on, not another dashboard they learn to ignore.

The Panovis Logic
Location turns information into intelligence.
A number changes meaning when you know where it happened, what surrounds it, what happened before, and what it affects. Our locational analytics establishes the spatial baseline, connects historical and live data, and identifies meaningful patterns, anomalies and relationships. The result is a clearer understanding of change—and the intelligence to decide what happens next.

What we cover
What turns data into a decision
Operational Dashboards
See the current state of assets, networks and operations through dashboards designed around the decisions users actually make.
Spatial Analytics
Reveal patterns, proximity, distribution, relationships and geographic trends hidden within complex datasets.
Alerting & Thresholds
Separate meaningful exceptions from normal variation with location-aware rules, thresholds and actionable alerts.
Predictive Analysis
Use historical and current data to identify emerging patterns, anticipate change and support proactive decisions.
Data Feeds & Integration
Connect sensor, survey, enterprise and operational data through a common spatial and analytical framework.
Scheduled Reporting
Turn recurring analysis into consistent management, operational and regulatory reports without rebuilding the answer each time.
Geospatial Visualisation
Present complex analysis through maps, charts and spatial views designed around the question—not simply the data.
Decision Support
Convert analytical findings into clear, prioritised intelligence that helps teams determine where attention and action are required.

What the analysis decided.
400+
Projects Delivered
400+
Specialists & Experts
5
Global Locations
5,000+MW
Renewable Energy Asset Intelligence
2,500+sq km
Mining Intelligence & Resource Mapping
5,000+sq km
Forest Intelligence & Carbon Monitoring
Where it applies
Where location shapes the decision
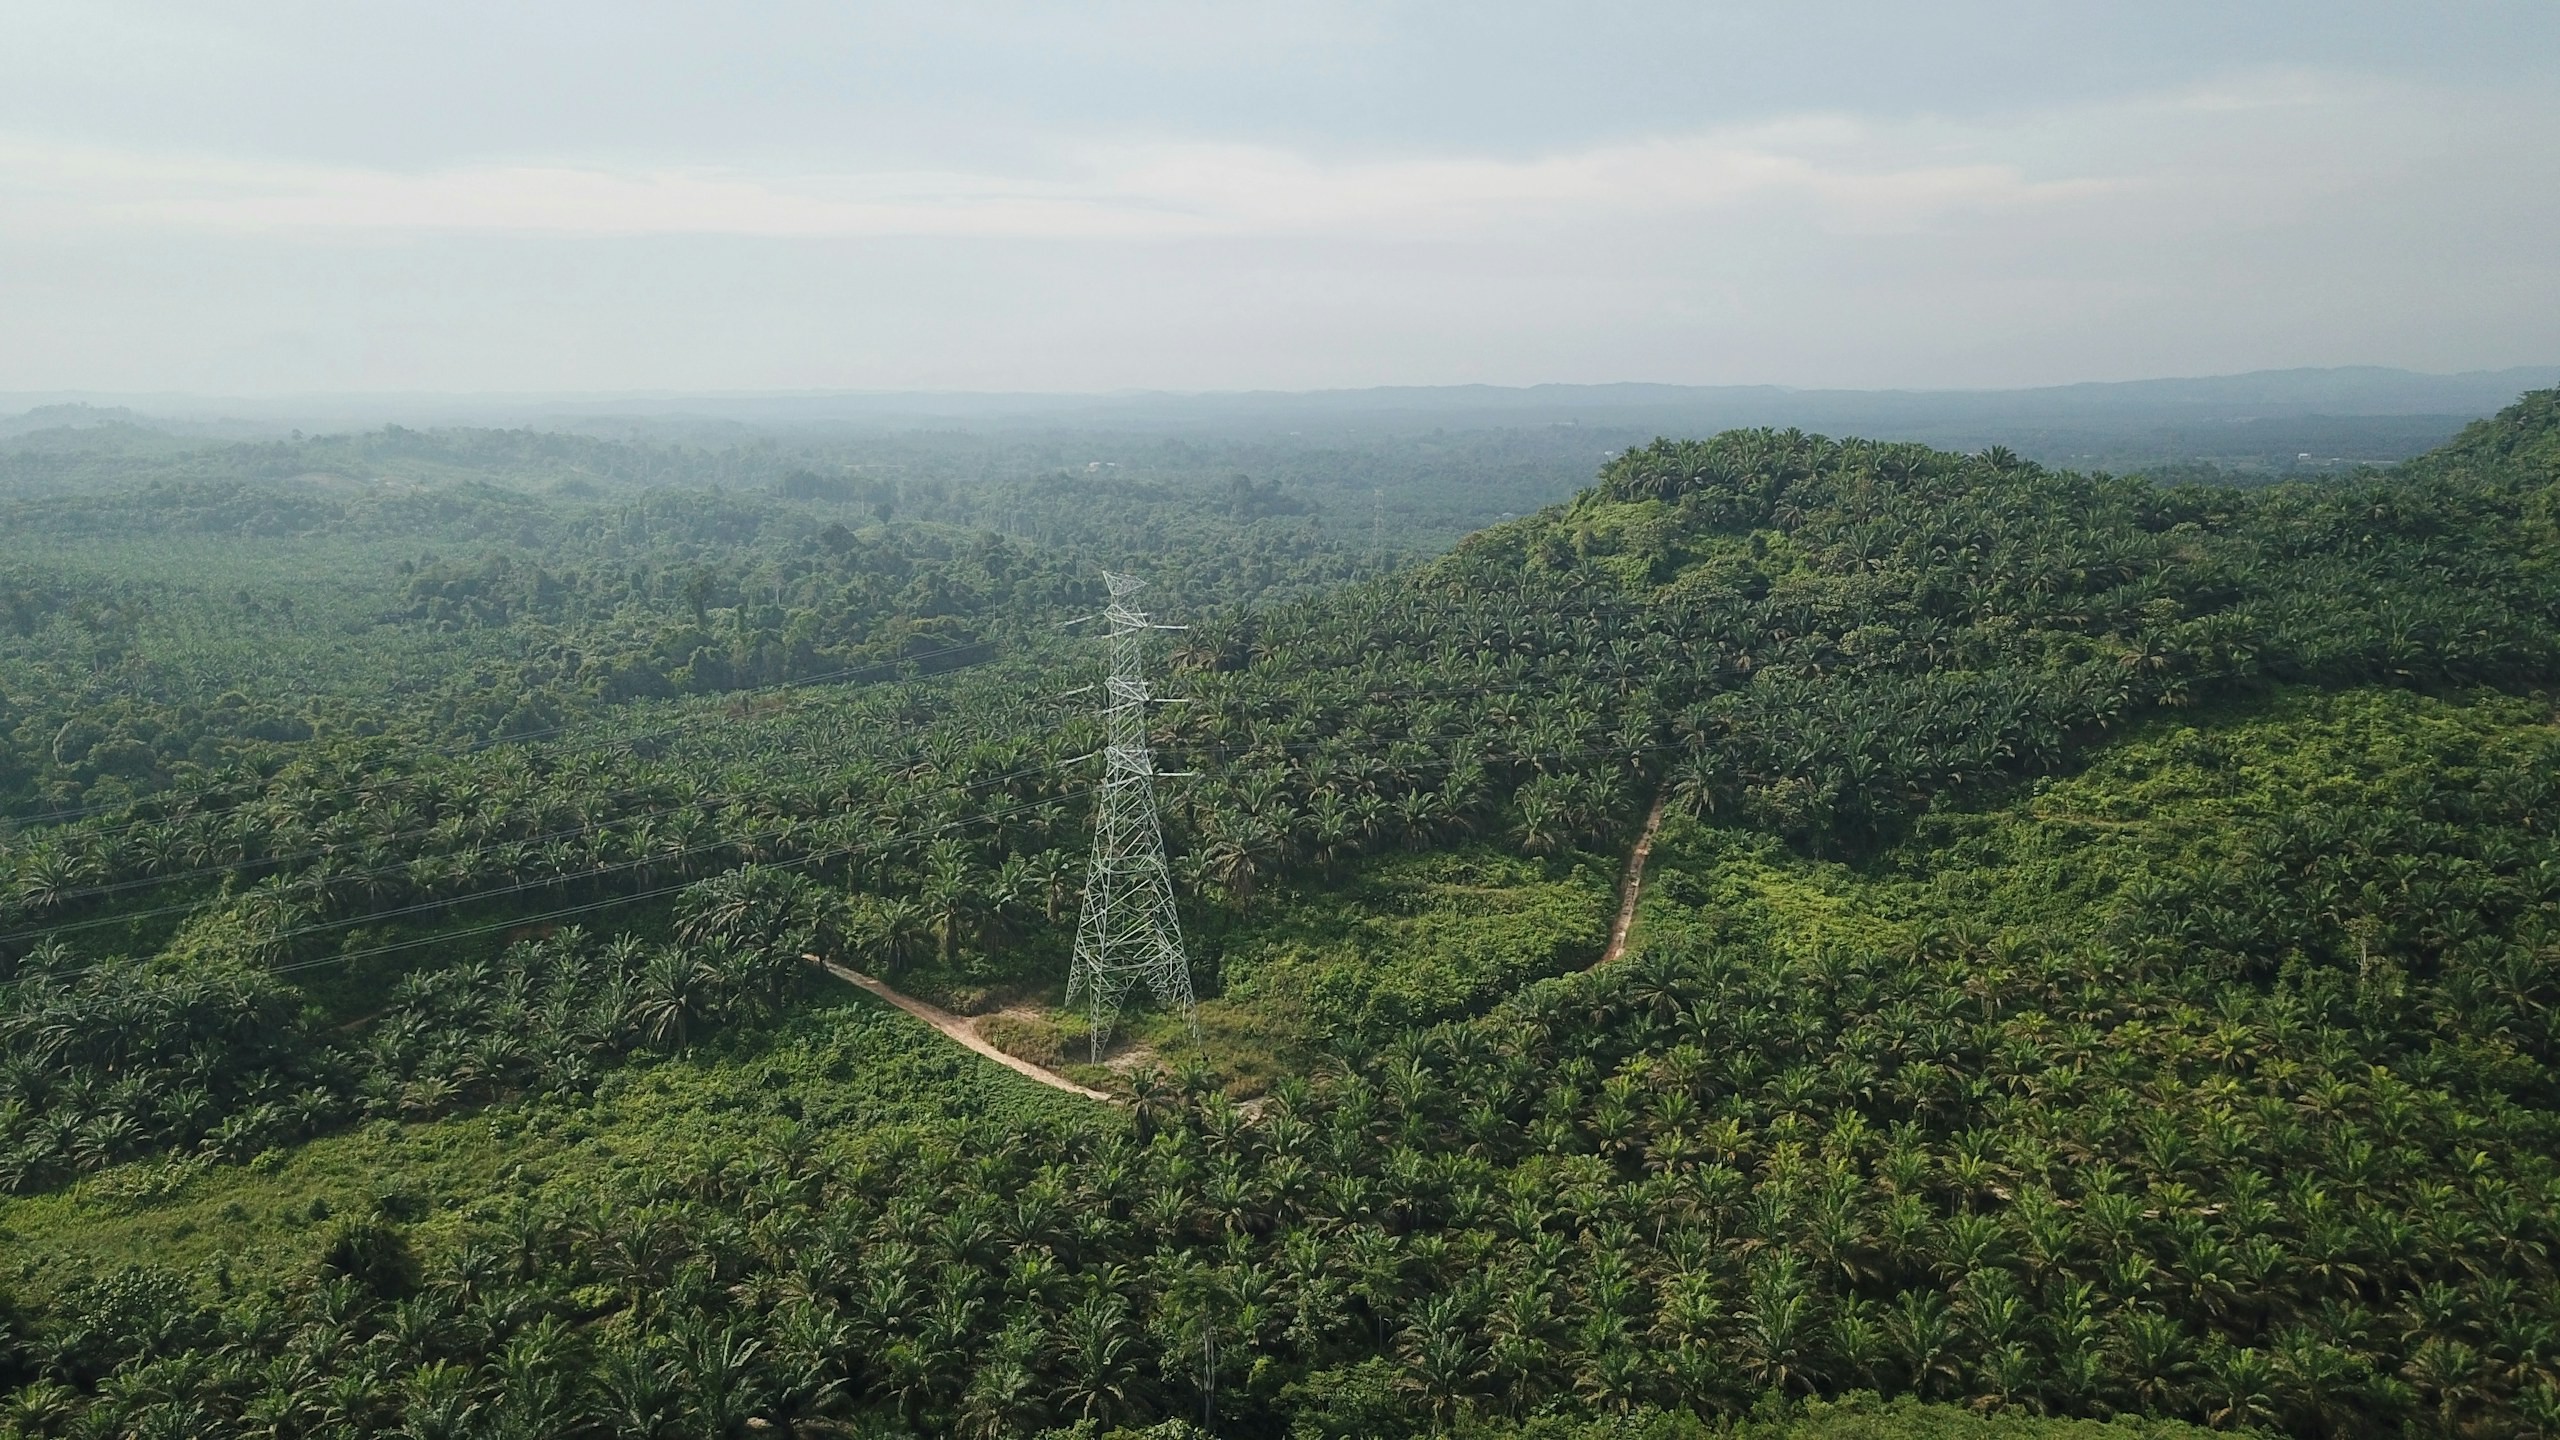
Utility & Energy
Distributed utility networks require precise asset visibility, network intelligence and timely operational insight. Our connected utility intelligence integrates Utility GIS, network mapping, IoT, Field GIS, asset tracking, network analytics, EAM, WebGIS and operational dashboards to connect field operations with enterprise decision-making.
Explore sector
Urban Development & Land Governance
Urban authorities need connected spatial, property and infrastructure data for effective planning and governance. Our solutions combine UAV mapping, cadastral GIS, 3D city models, WebGIS and spatial analytics for informed decision-making.
Explore sector
Infrastructure
Infrastructure projects generate complex spatial, engineering, asset and field data across their lifecycle. Our integrated geospatial intelligence combines UAV surveys, GIS/WebGIS, LiDAR, photogrammetry, asset mapping, digital twins and spatial analytics to enable informed planning, monitoring and lifecycle management.
Explore sector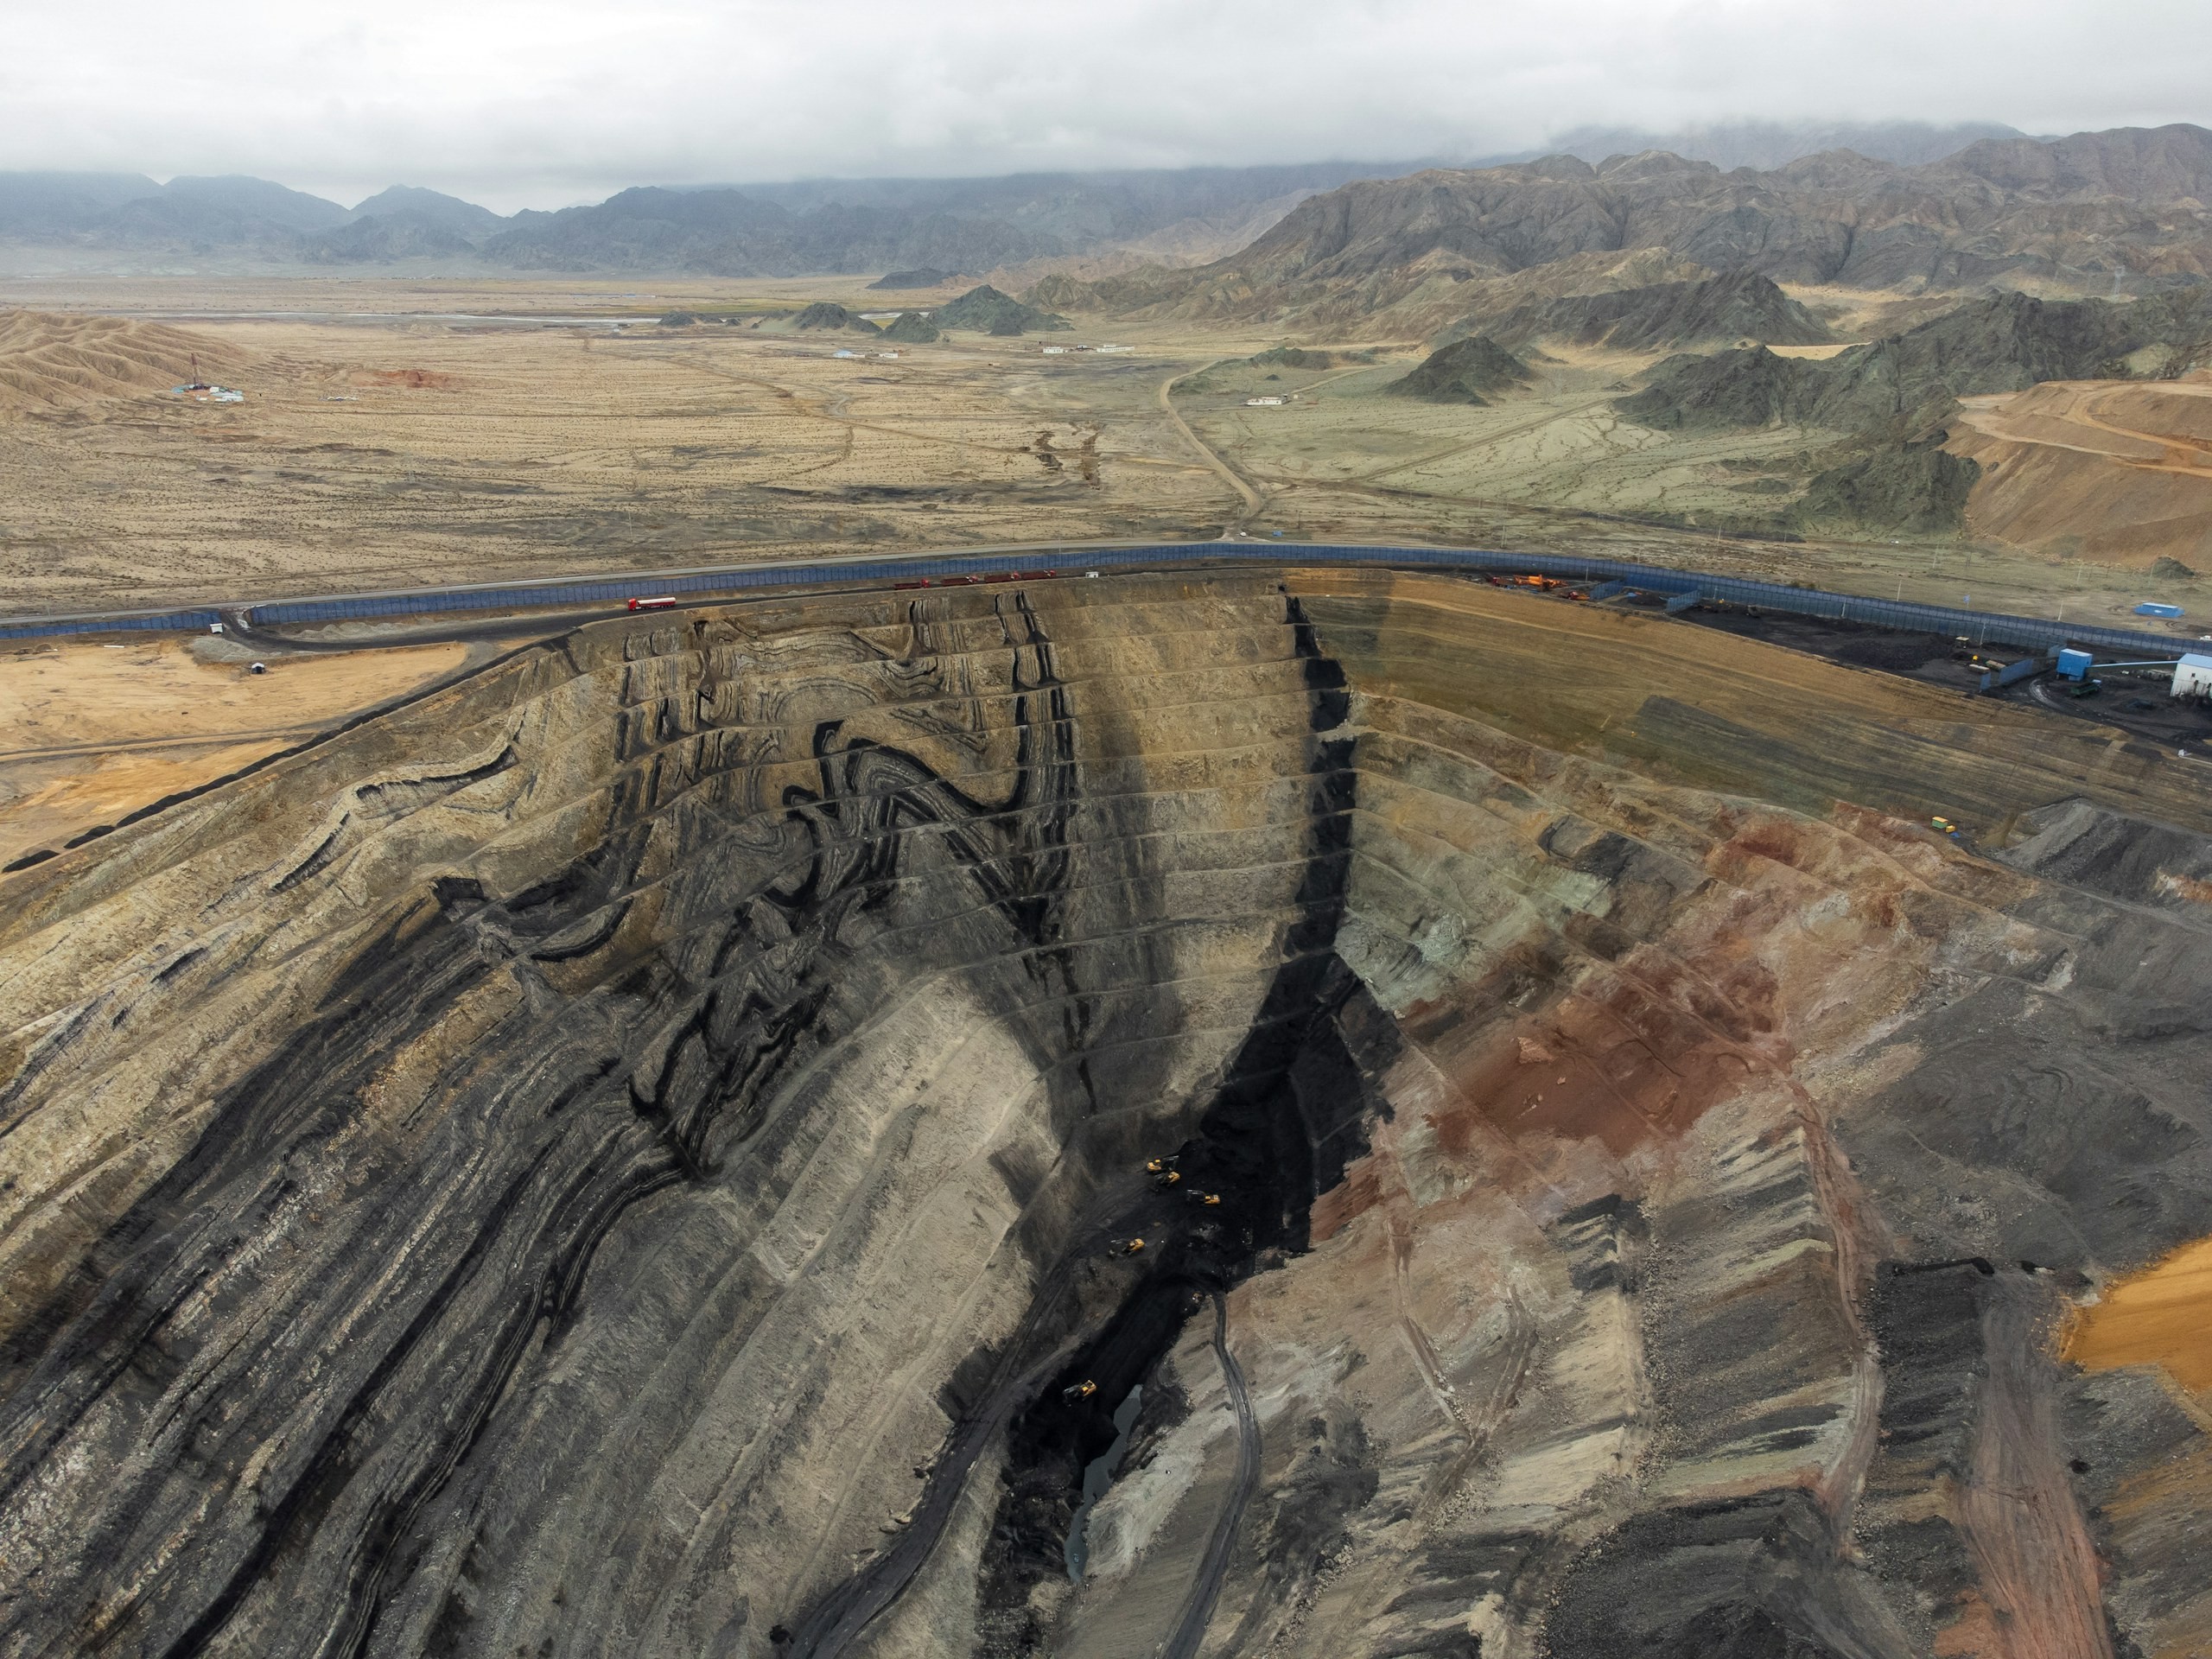
Natural Resources & Mining
Mining and natural-resource operations require accurate, spatially referenced intelligence across terrain, volumes, extraction areas and operational sites. Our solutions combine UAV and LiDAR surveys, photogrammetry, terrain modelling, volumetric analysis, remote sensing, GIS and spatial analytics for precise measurement, monitoring and operational planning.
Explore sector
Let’s solve the spatial challenge
Tell us what you’re trying to build, map, monitor or manage. From large-scale surveys and geospatial intelligence to digital twins, asset monitoring and enterprise integration, our team can help define the right data, technology and delivery approach for your requirement.
- EnquiriesPanovis@trentar.com
- Registered officeMumbai, India