

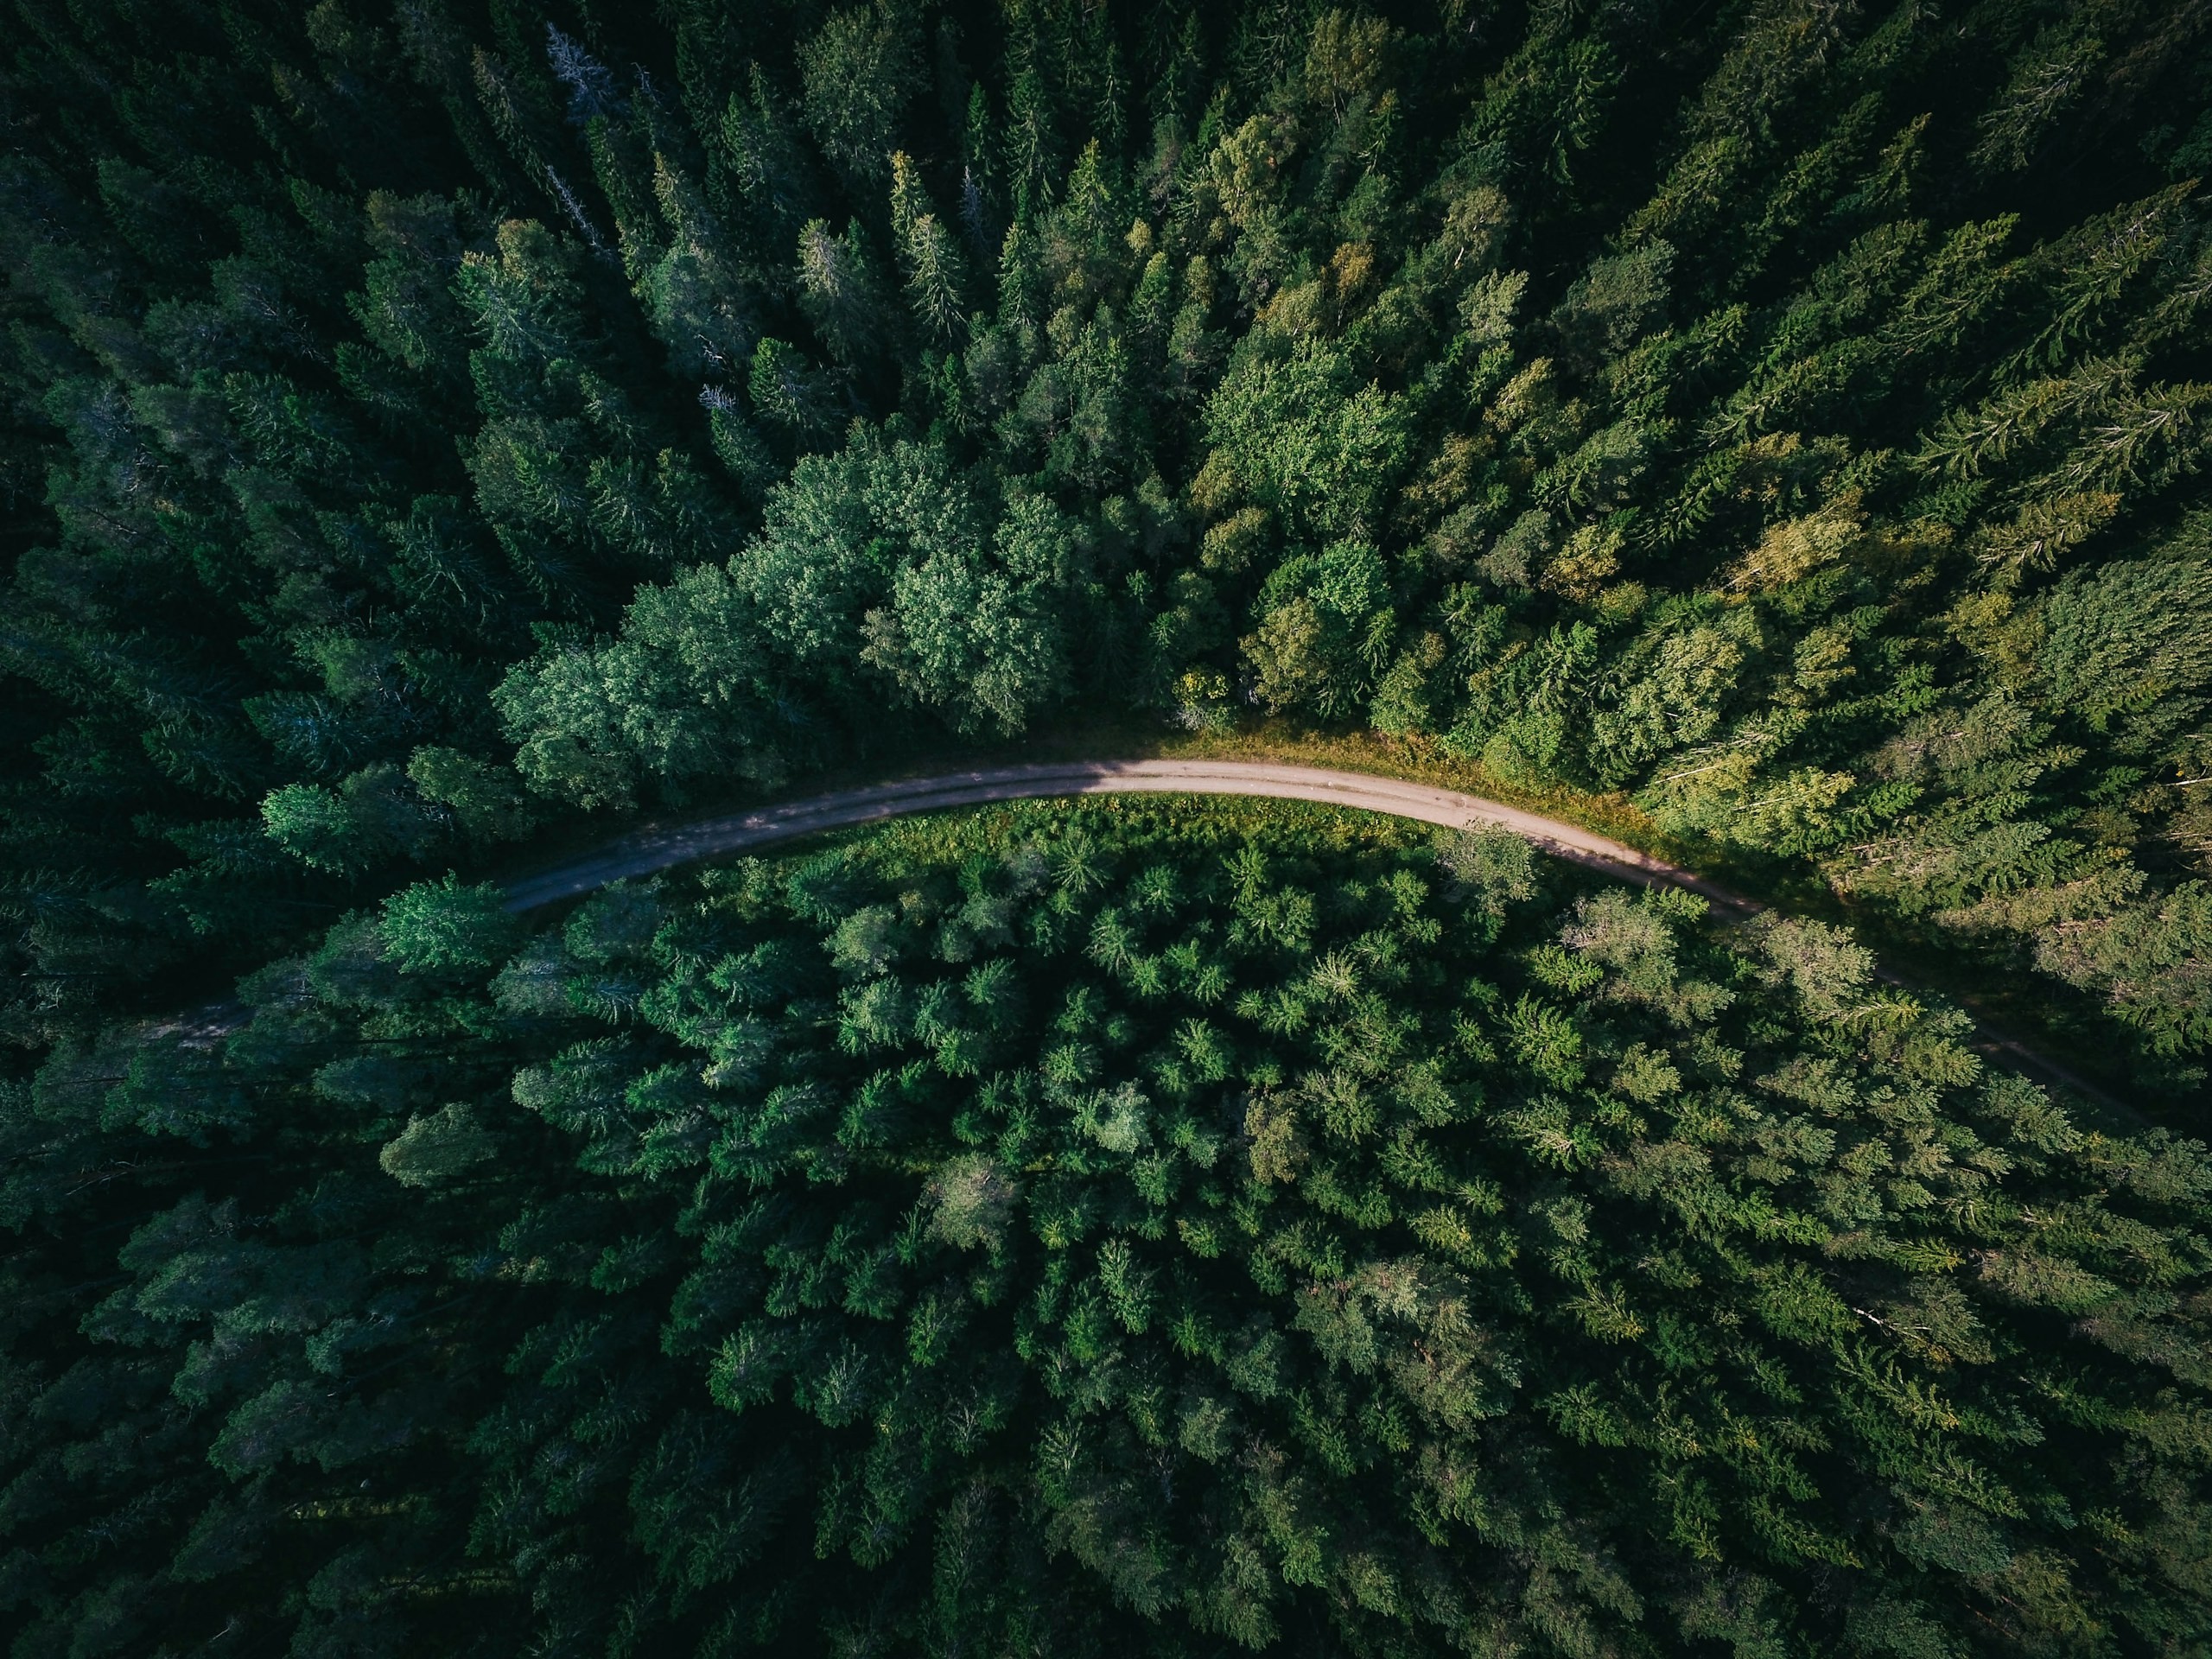
Environment, Forest & Climate Change
Environmental programmes need reliable spatial data to monitor forests, biodiversity, land cover and climate risks. Our solutions combine UAVs, remote sensing, LiDAR, GIS and spatial analytics for monitoring and sustainable resource management.
Trusted by

The problem
A baseline is only useful if it can be measured again
Forest assessments often combine ground observations with satellite and aerial data, but limited field plots cannot describe conditions continuously across large and changing landscapes. By the time a comprehensive inventory is completed, fire, harvesting, regeneration, land-use change or seasonal variation may already have altered parts of the area.
A defensible baseline therefore needs a documented methodology, clearly defined reference data and measurements that can be repeated over time. This makes change detection comparable rather than simply showing two different snapshots of the landscape.
- Documented methodology aligned with the applicable programme or assessment criteria
- Repeatable change detection against a defined and re-measurable baseline
- Uncertainty and limitations quantified and reported alongside the results
In detail
What a canopy measurement rests on
Canopy structure is derived from the relationship between vegetation and the ground beneath it, making a reliable ground surface critical to the measurement. In dense or closed-canopy forests, conventional photogrammetry can have limited visibility of the ground, while LiDAR can provide substantially better penetration through canopy gaps. The resulting ground classification still needs appropriate validation, particularly where terrain is complex or canopy density is high.
Biomass and carbon estimates then depend on how remotely sensed measurements are combined with field observations and appropriate allometric or statistical models. Species, forest type, stand structure and local conditions can materially influence the estimate, making the methodology as important as the sensor.
Change detection presents a similar challenge. Two datasets are comparable only when their acquisition, reference systems, processing and classification methods are sufficiently consistent to distinguish real environmental change from differences introduced by the data itself.

The panovis advantage
What a forest division actually asks for
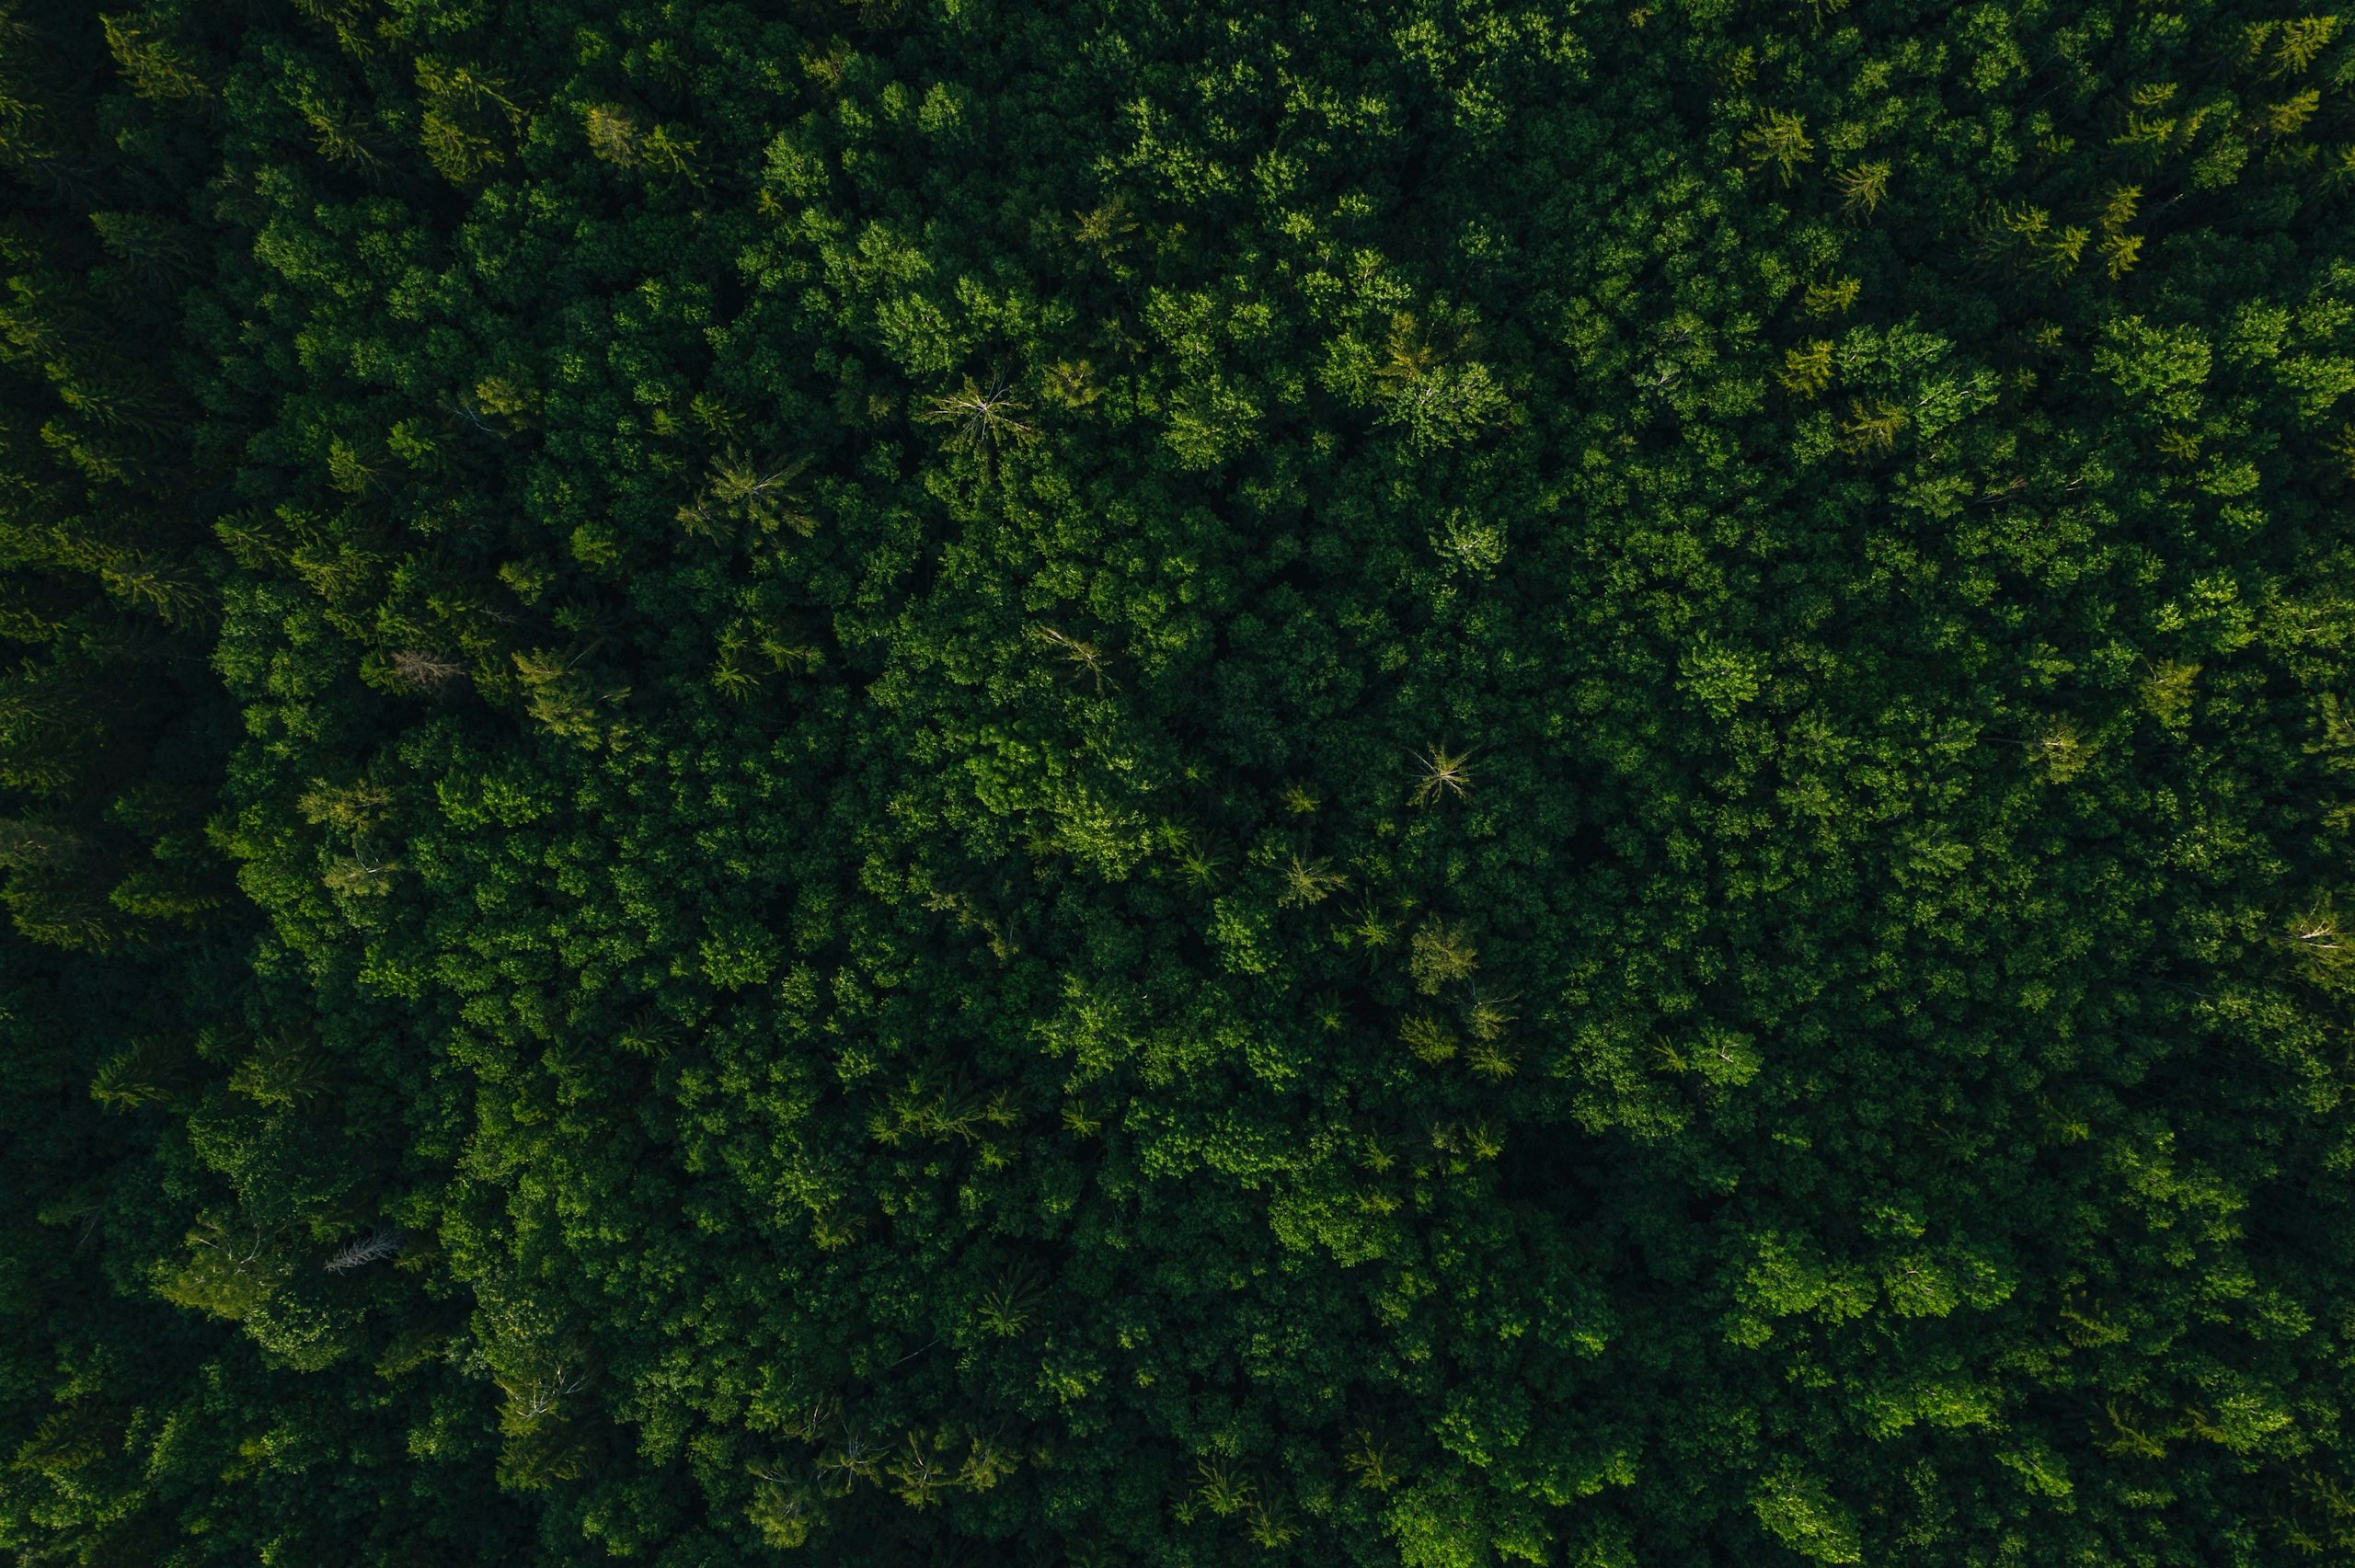
Canopy & Forest Structure
Measure canopy cover, height and structure at compartment level, using LiDAR where canopy density limits ground visibility.
Biomass and carbon
Estimate above-ground biomass and carbon stocks using documented field, remote-sensing and allometric methods.
Forest Composition & Health
Map forest types and, where imagery and reference data support it, species composition using multispectral or hyperspectral data, with vegetation stress and pest indicators.
Fire Risk & Burnt Area
Assess vegetation and fuel-related conditions, detect active fire using thermal data where appropriate, and map burn extent against pre-fire conditions.
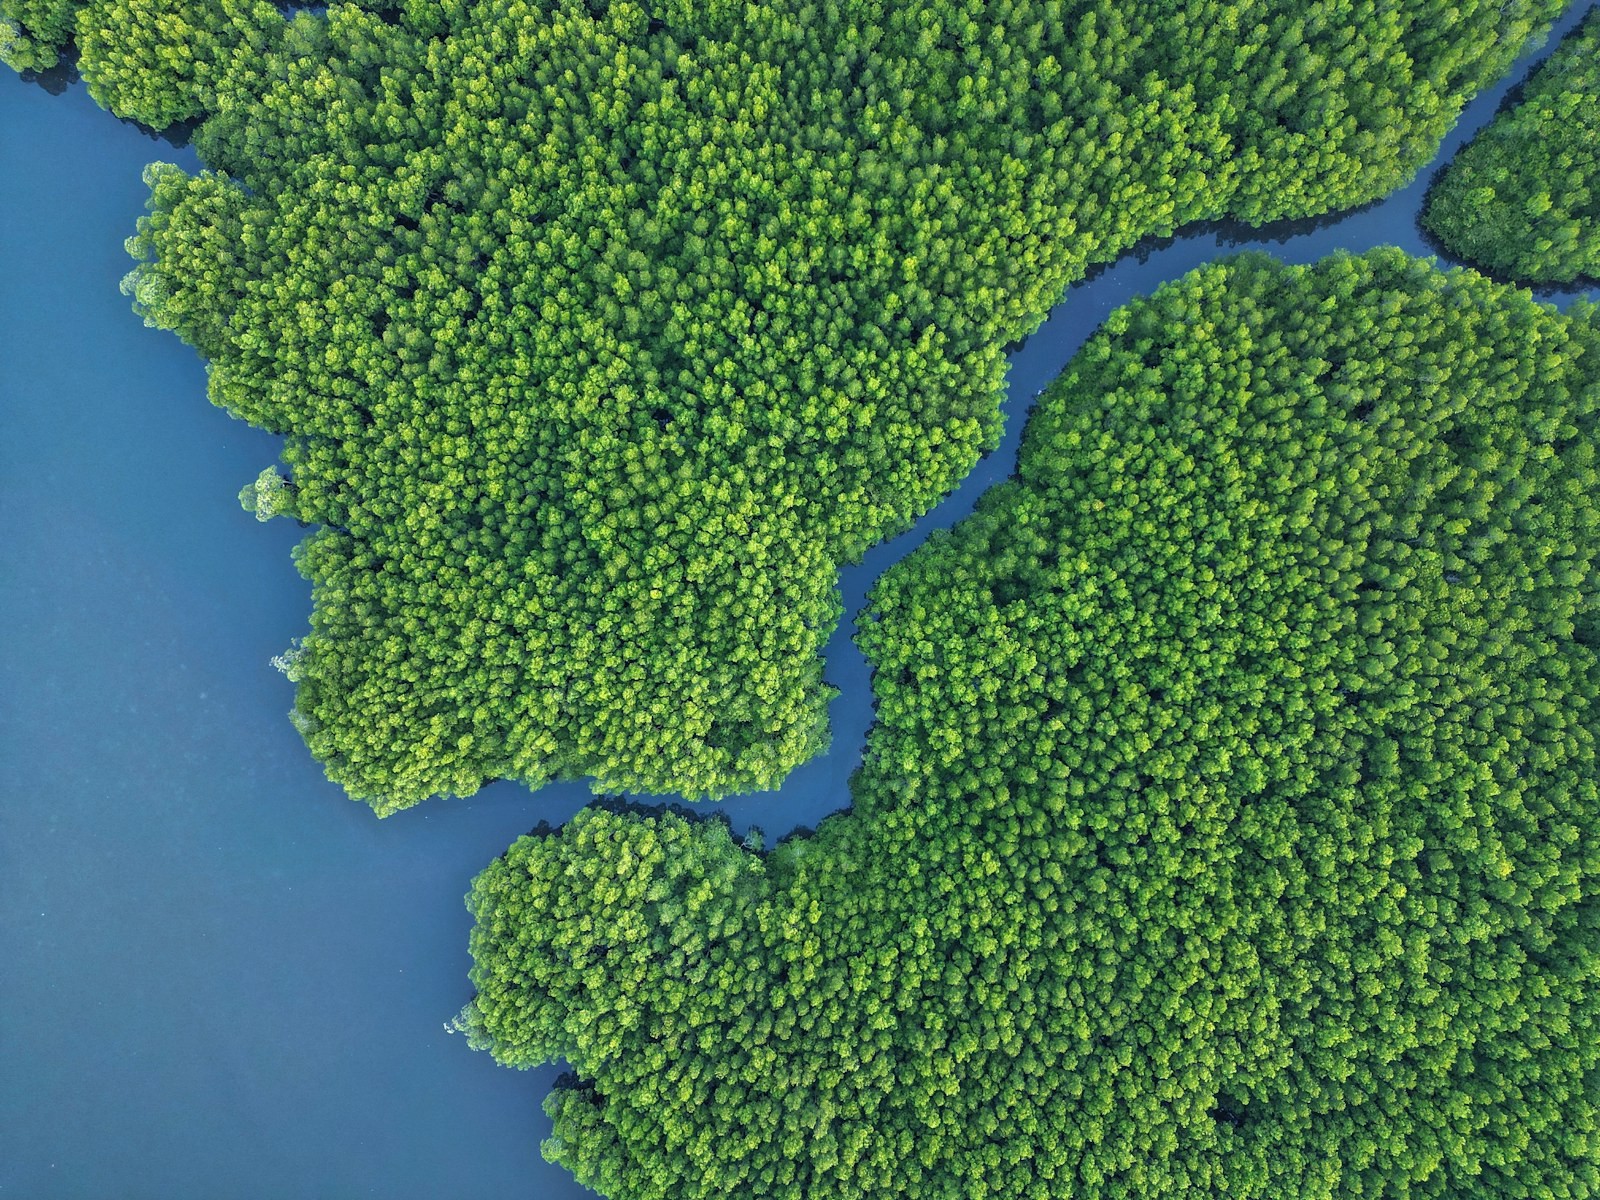
Mangrove & Wetland Monitoring
Map extent, monitor vegetation and restoration progress, and assess inundation patterns across mangrove and wetland ecosystems.
Encroachment & Forest Corridors
Monitor defined boundaries, detect land-cover change and map wildlife corridors against surrounding development and land-use pressures.
Forest and climate work, in numbers
400+
Projects Delivered
400+
Specialists & Experts
5
Global Locations
20,000+sq km
Aerial & Remote Sensing Intelligence
5,000+sq km
Forest Intelligence & Carbon Monitoring
What we bring
Solutions we bring to environmental work
Capture and analysis with the evidence trail attached.
Layer 1
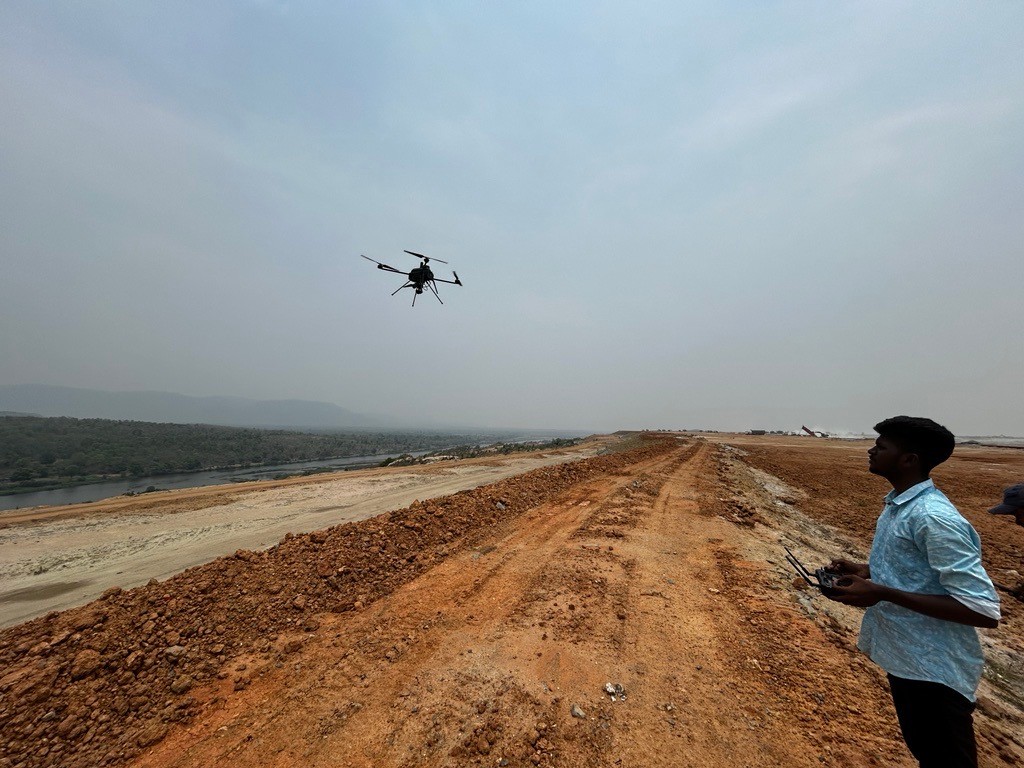
Capture
Getting survey-grade data off the ground, from the air and from orbit.
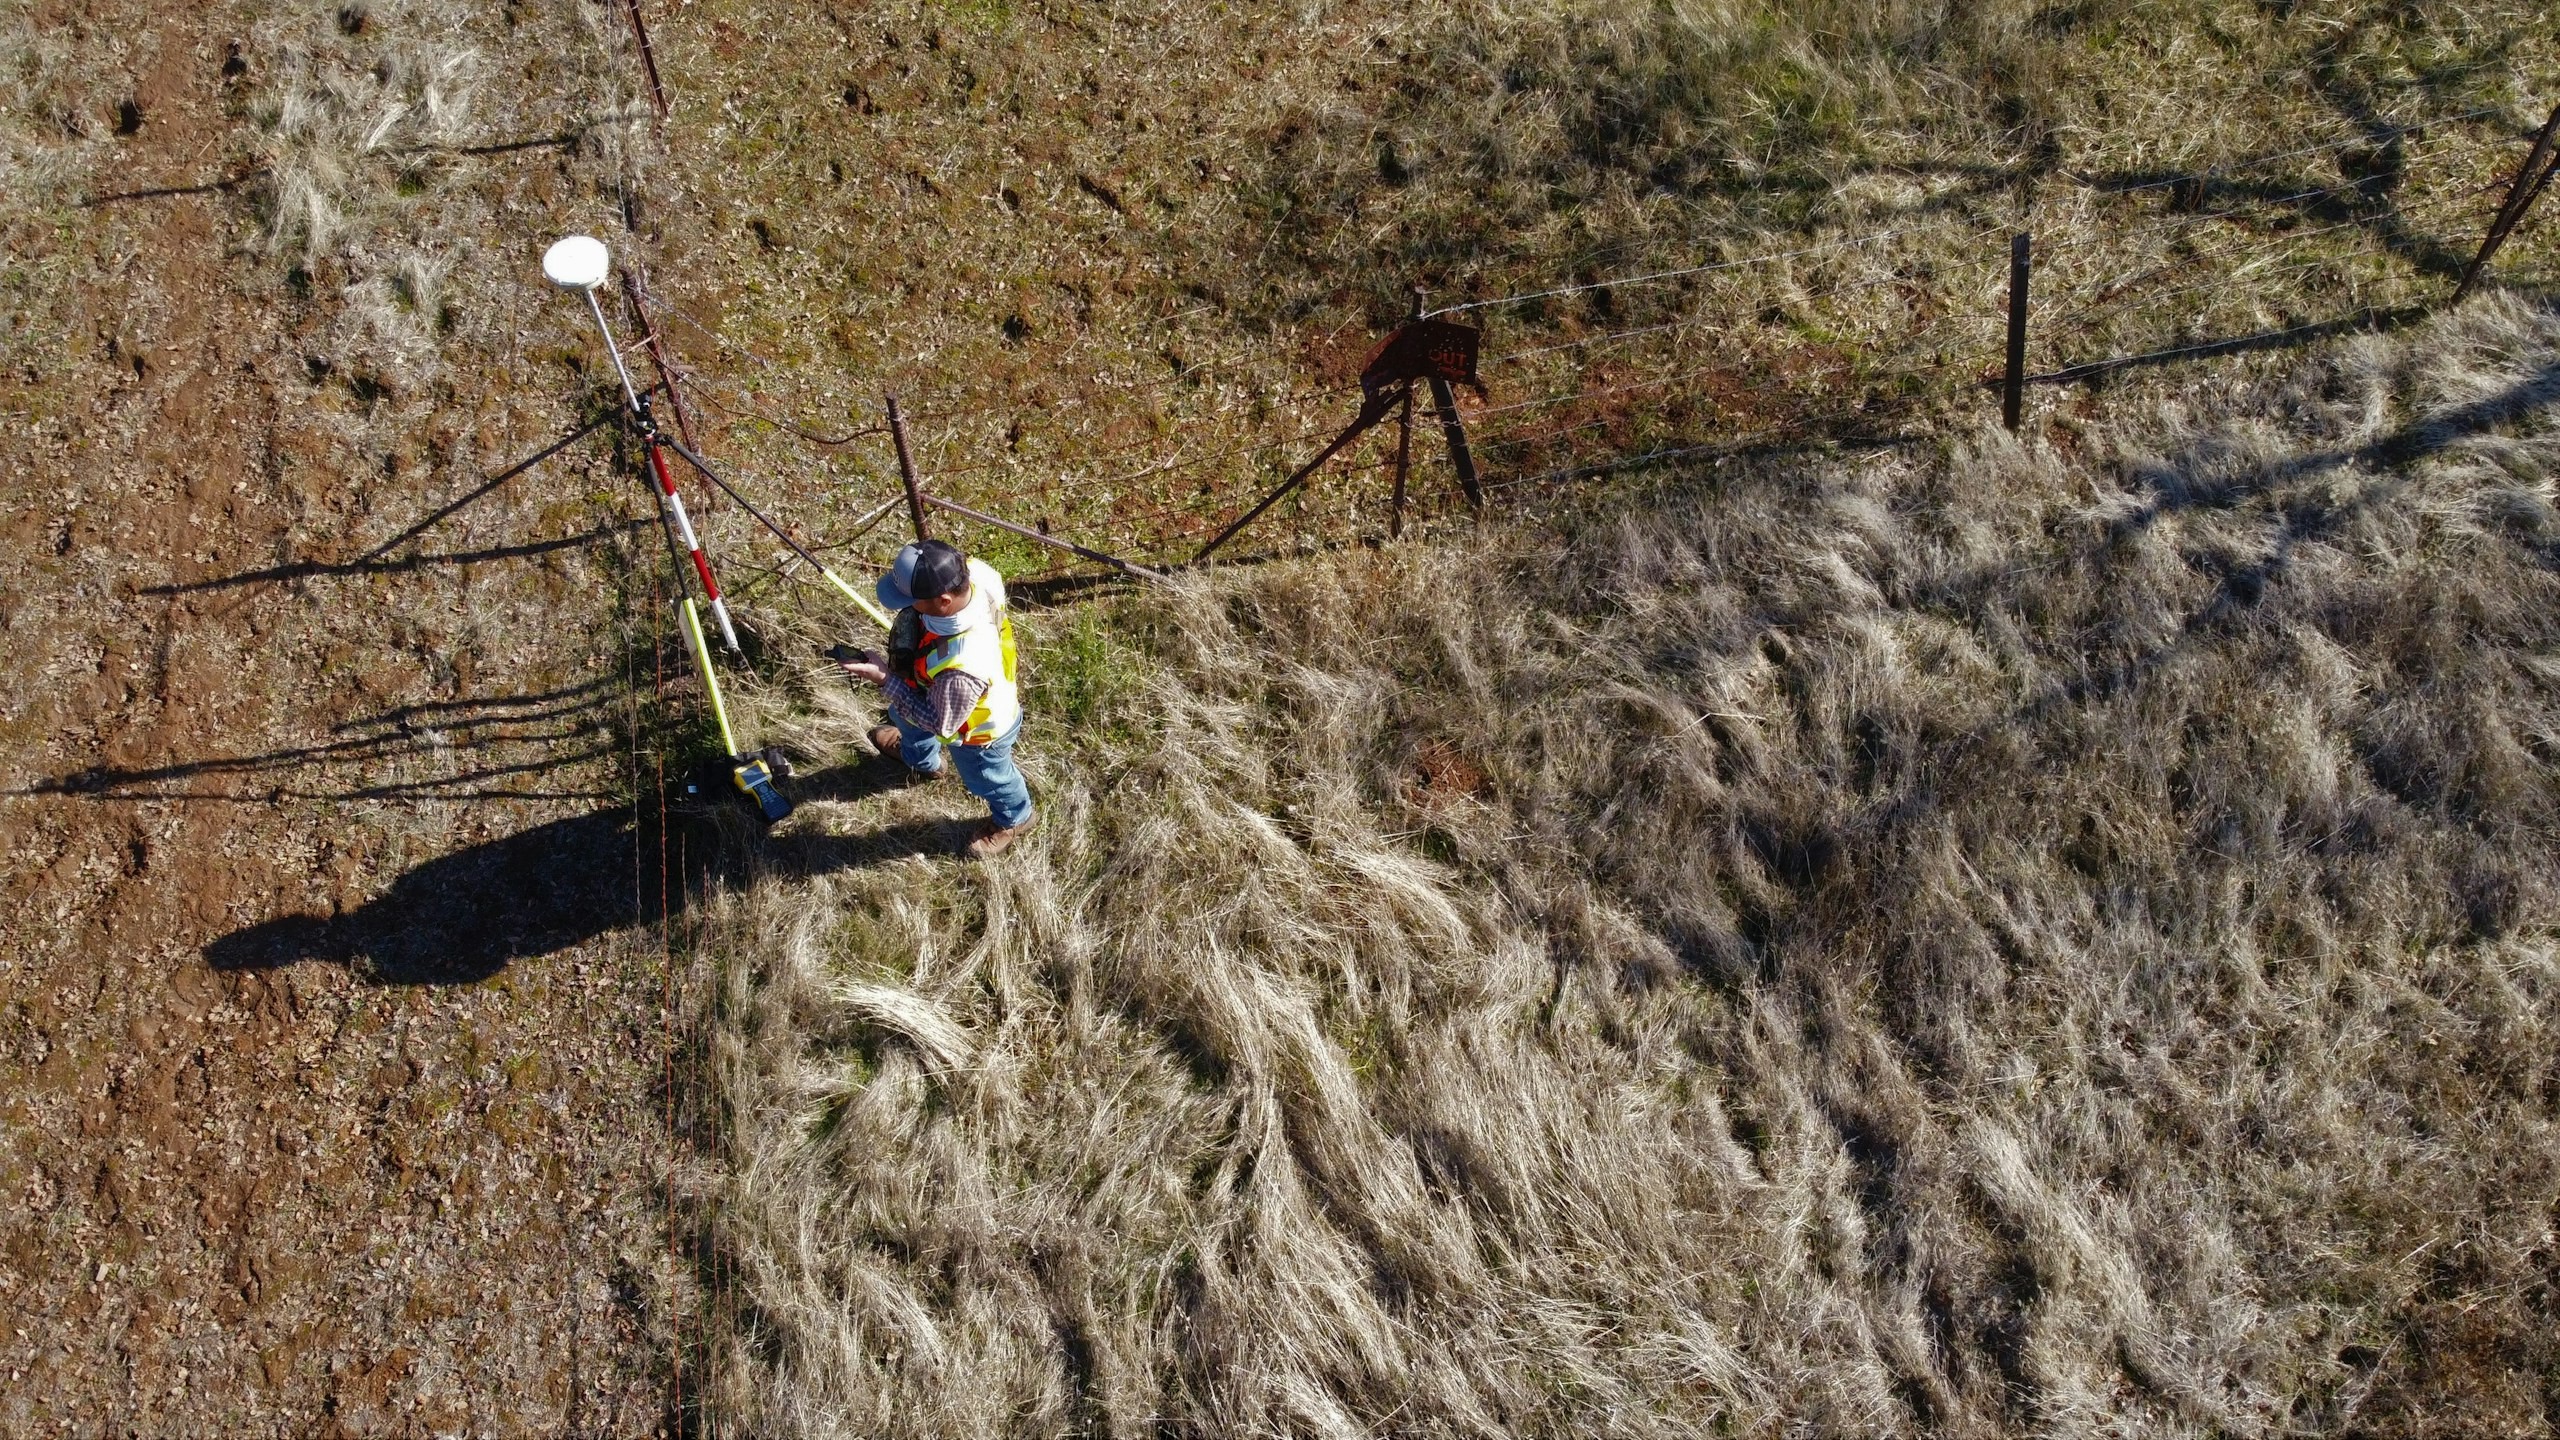
- Aerial
- UAV
- LiDAR
- Remote Sensing
- Photogrammetry
Applications
Applications in environment and climate
Forest carbon and disaster risk, the two ends of the same climate brief. The detail pages sit on the GarudaUAV site, from the practice that became Panovis.
Let’s solve the spatial challenge
Tell us what you’re trying to build, map, monitor or manage. From large-scale surveys and geospatial intelligence to digital twins, asset monitoring and enterprise integration, our team can help define the right data, technology and delivery approach for your requirement.
- EnquiriesPanovis@trentar.com
- Registered officeMumbai, India